Fullcast simplifies the capacity planning process by allowing for top-down and bottom-up planning using a shared set of data. Unlike traditional methods that rely on disparate spreadsheets, Fullcast ensures that all teams work from the same data, which helps maintain alignment across the organization. This unified approach allows RevOps to play a more strategic role in goal setting and helps ensure that sales targets are realistic and achievable.
Use scenario planning to model different revenue strategies and determine the best allocation of resources. When you combine scenario modeling with capacity planning, you can determine how many reps you need and how much quota you should assign them to hit your revenue goals.
Refer to Video: Introduction to Capacity Planning.
Scenario planning
Use scenario planning to model various possible events or scenarios that can take place in the future to determine the best course of action for allocating available resources to maximize returns.
When performing scenario analysis, it is common to start with three basic scenarios:
Best Case: Optimistic projections
Worst Case: Conservative projections
Base Case: Expected outcome
Once you build a base case scenario, you can snapshot it and then create best case and worst case scenarios from it.

Profit and loss (P&L) statement model
ROI is a measure of the profit or loss the company receives to its bottom line as a result of the investment in sales and marketing. It is also referred to as the Contribution Margin in finance circles. The factors that contribute to ROI include:
Productivity of employees
Profitability of various sales programs
The efficiency of deploying the right mix of resources for maximum return
Scenario planner in Fullcast uses a proforma profit and loss template to model the ROI in a particular scenario based on various inputs. Use a consistent model in scenarios to compare between different models.
The elements of the proforma P&L statement for revenue teams:
Revenue Items — the projected revenue from various products and services sold by the company.
Cost of Goods Sold (COGS) — all costs and expenses related to the production of the products sold by the company. COGS excludes sales and marketing costs and should only consider the cost incurred in producing the products sold to customers in the year of concern.
Gross Income — calculated by subtracting COGS from Revenue. Gross profit includes variable costs and does not account for fixed costs.
Net Income — a company's profit after all expenses have been deducted from revenues. Net Income or Net Contribution can be thought of as the returns on the investment into sales, marketing, and customer management functions.
Model inputs and sensitivity analysis
The P&L items mentioned above are typically projected based on assumptions made along with various independent variables (or drivers). To perform scenario analysis, these input drivers can be adjusted to create various scenario models that can then be used to determine the best course of action.
Sensitivity analysis determines how different values (or uncertainty) of a model input affect the scenarios. This is also referred to as What-if or simulation analysis. This differs from scenario analysis where specific events or situations are modeled as opposed to uncertainty in a particular model input. For example, in scenario analysis, you may model an economic downturn whereas in sensitivity analysis you may look at what happens if the employee productivity assumption varies by +/- 5% on either side.
Both scenario and sensitivity analysis can be performed using the Fullcast scenario planner.
Create a scenario
As you grow your usage of the scenario planner, create multiple scenarios. For example, create a base scenario then clone (duplicate) and modify it to create best case, worst case, re-cast, and so on.
Capacity planning
The capacity planning process in Fullcast involves five components:
Ramp and productivity profiles (schedules): For the roles you are creating the capacity plan for.
Current headcount and team structure: To base your capacity model on.
Scenarios: Where the models will live.
Productivity model: Determines the top-down average quota and number of reps needed to achieve your revenue targets.
Effective headcount model: Provides bottom-up capacity planning, including making manual adjustments, planning your to-be-hired roles, and more.
Once you have generated your initial model, the Effective Headcount model and the Details tab is where you configure and refine your capacity plan:
Edit the details in the effective headcount model’s Details tab (if you change the inputs for the Effective Headcount model, the Details tab displays a yellow indicator prompting you to add or remove TBHs based on the updated inputs).
Adjust inputs in the productivity model.
Clone your models and creating alternative versions.

Note
In the models, you can select from multiple input data sources. Type values manually or leverage data available in Fullcast.
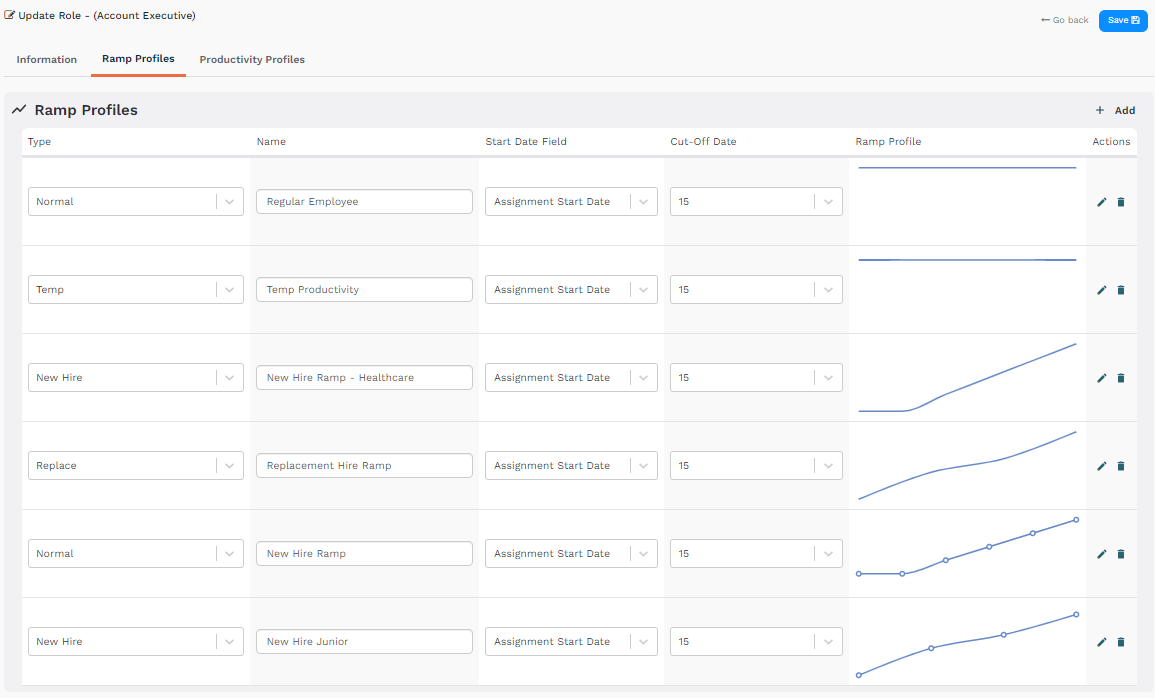
Ramp and productivity profiles
Set up ramp and productivity profiles for the roles you are building the capacity plan for. At a minimum, you need one role with its associated profiles.
Ramp profiles calculate the effective capacity of your team. This schedule is based on tenure and experience in role.
Productivity profiles schedule quota across the year. This schedule is based on the seasonality of your business.
For example: Create multiple ramp profiles for more detailed and accurate quota expectations.
Productivity Profiles contain base assumptions for a role’s quota goal and allocation of that quota across the year.

Refer to:
Organizational structure and headcount in teams
Configure your organizational structure and current headcount in the Teams module. The level of detail you create in the team structure determines the granularity available later in effective headcount modeling. For example, to plan headcount by region, build a regional structure.
For example: Sales team structure, broken down by Global Regions and then by Segments or other smaller teams.

Refer to:
Productivity Model
Create the productivity model to translate revenue targets into quota and headcount requirements—how much quota each rep needs to carry for the organization to hit its revenue goals.

Inputs
These can all be either manually entered or calculated leveraging your historical data and other models within Fullcast Scenarios.
Attainment: Average quota attainment expressed as a percentage. Type this manually or calculate it from historical targets in Fullcast.
Quota: Average monthly quota for a fully ramped rep. If you have targets in Fullcast, calculate this using historical data. To enter it manually, type your average quota per rep divided by 12.
New Revenue Required: Your revenue goal for the year. Often entered manually based on direction from finance or leadership. Create a schedule based on seasonality to spread it across the year.
Outputs
Required Carried Quota: How much quota, on average, each rep needs to carry. Calculated by factoring together your new revenue required, average quota per rep, and attainment factor. The model automatically calculates and displays Required Carried Quota across monthly/quarterly periods and totals.
Ramped Reps (person months): The number of fully ramped reps required each month to hit your revenue goal.
Refer to:
Effective headcount Model
The effective headcount model is where you do the majority of your capacity planning work. After you enter inputs into the model configuration, the main output appears in the Details tab—a table with all your headcount in rows and their productivity and quota data broken down by month or quarter in columns.
The effective headcount model integrates with the productivity model. Use the productivity model’s ramped reps output as the required effective headcount input to connect top-down revenue planning with bottom-up staffing.

Inputs
Current headcount: The starting point for the model. Source this from the Teams module or use existing territory coverage assignments. Edit Assignment Start Dates for current headcount records directly in the Details tab to ensure accurate baselines. This prevents inflated calculations caused by people being treated as active from the beginning of the model period when they actually started later.
Role and Ramp Profile: Sets the assumptions for any to-be-hired reps. Although you choose one role here, you can edit individual ramp profiles in the Details tab. For example, you can leverage multiple ramp profiles for your TBHs that you create.
Attrition: Type a value manually, or calculate a historical value from available data. For example, if you have fields on the user record that indicate terminations, calculate a historical number of terminations per year to project attrition. Attrition can be set to zero for scenarios where no attrition is expected. Attrition rows can also be assigned a role, productivity profile, and annual productivity, which generates negative carried quota values—ensuring headcount loss is properly reflected in revenue and productivity projections.
TBR Hire Lead Time: Type a value manually, or calculate a historical value from available data.
Required Effective Headcount: The base number of fully ramped reps required to hit revenue goals. Select the productivity model’s ramped reps output to automatically populate the seasonality schedule from that model.
Avg Monthly Quota (Fully Ramped Rep):The average monthly quota for a fully ramped rep. The model uses this value to calculate and display Required Carried Quota across monthly/quarterly periods and totals.

Outputs
Snapshot: Figures broken down by month show:
TBR effective replacements and actual replacements.
TBH effective headcount and actual headcount
Effective headcount—the total number of people per month that you need.
Revenue gap—the monthly and total shortfall between Required Revenue and current revenue capacity (Current + Attrition + Replacements). Use this metric to align capacity planning decisions with revenue targets.
Details: A table view with all headcount, their productivity and ramp assumptions, and the breakdown of the productivity expectation per month. Make individual or bulk adjustments directly within this table:
Edit ramps and productivity profiles for current, TBH, and TBR headcount.
Move headcount between teams.
Manually adjust quotas as needed.
Edit assignment start dates for current headcount to ensure accurate baseline calculations.
View gap (excl. new hires) and gap (incl. new hires) rows to verify whether your hiring plan closes the headcount and revenue capacity gap.
View required carried quota across monthly or quarterly periods.
View negative carried quota values on attrition rows assigned productivity profiles.