This guide begins with an overview of the components of capacity planning in Fullcast. It then provides a breakdown of the process involved in setting up each of these components. For a short video introduction, refer to Introduction to Capacity Planning in Fullcast.
Overview of Capacity Planning Components
The basic capacity planning process in Fullcast involves five components:
The ramp profiles and productivity profiles (schedule) for the roles you are creating the capacity plan for
The current headcount and team structure that you will use to base your capacity model on
Creating a scenario where the models below will live
The Carried Quota model which determines the top-down average quota and number of reps needed to achieve your revenue targets
The Effective Headcount model which provides bottom-up capacity planning, including making manual adjustments, planning your to-be-hired roles, and more.
The primary outcome
The Effective Headcount model and the details view is really where the bulk of the work is done. You can tweak your capacity plan in many ways there.

Figure 1.
A note on models and data sources
In the models, you will have many options for input data sources. You can either manually input numbers or you can leverage data available in Fullcast. This article mentions some common methods of sourcing the data inputs. See the GIF below for a quick visual on how to actually input numbers.
Ramp and Productivity Profiles
The first preparation step for capacity planning is to set up ramp and productivity profiles for a role. At a minimum, you need one role to base the capacity plan on. For that role, you will create the associated ramp and productivity profiles.
Ramp profiles are used to calculate the “effective capacity” of your team. This is essentially a productivity schedule based on their tenure and experience in role.
Productivity profiles are used to schedule out the quota across the year. This is essentially a productivity schedule based on the seasonality of your business.
Example
Creating multiple ramp profiles allows you to get more detailed and accurate quota expectations. In Figure 2 below, you can see example Ramp and Productivity profiles for an Account Executive Role.
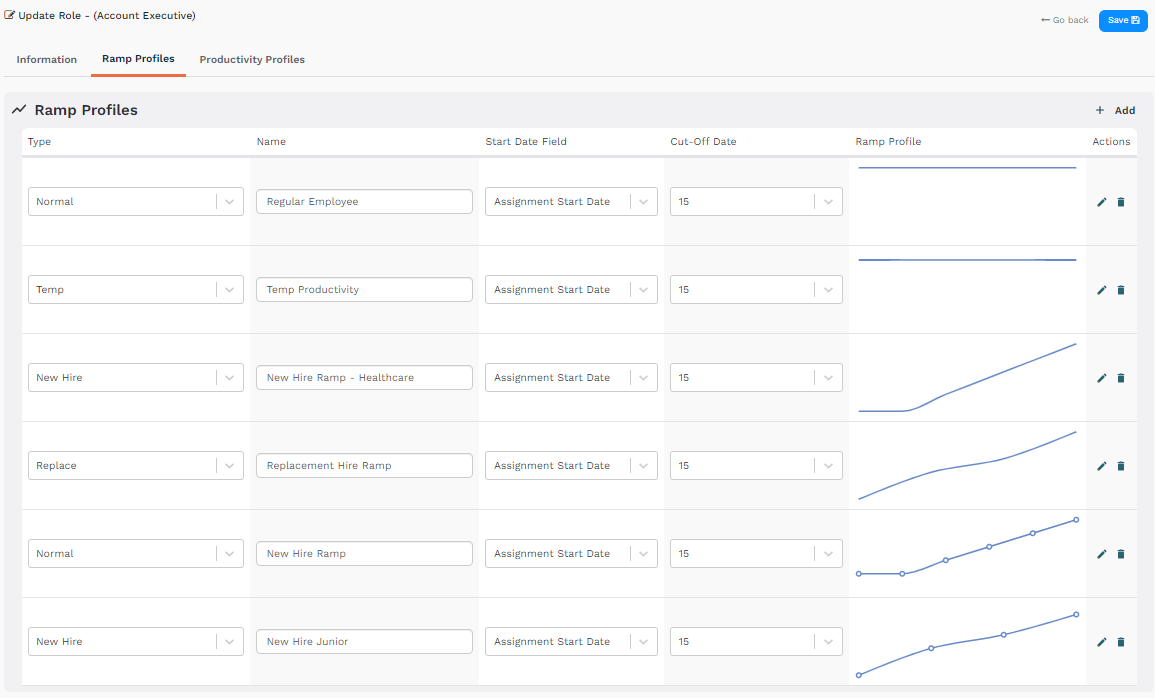
Figure 2. A variety of ramp profiles for an account executive role.
Productivity Profiles contain base assumptions for a role's quota goal and allocation of that quota across the year. In Figure 3, you can see two example productivity profiles for an SMB and Enterprise Account Executive, each with a different goal and productivity profile.

Figure 3. Two productivity profiles for AEs
How-to Documentation
Organizational Structure and Current Headcount in Teams
Once you have your role setup, you need to set up your organizational structure and current headcount in the Teams module. The level of detail you create in the team structure will be the same level of detail you can leverage down the road in your Effective Headcount modeling. For example, if you want to be able to plan out which regions you’ll put a new headcount in, you need to have the regional structure built in the Teams module.
Example
In Figure 4, you can see a Sales team structure, which is broken down by Global Regions and then by Segments or other smaller teams.

Figure 4. Teams structure
How-to Documentation
Scenario Creation
Once you’ve done the steps above in the Roles and Teams areas of the Fullcast platform, you will move to the Scenarios module. To get started, simply create a new scenario using the documentation below. As you grow your usage of the scenario planner, you can create multiple scenarios. For example, you might create a base scenario then clone (duplicate) and modify it to create best case, worst case, re-cast, etc.

Figure 5. The Scenarios tab contains folders that can hold multiple scenarios
Note: to create a new folder, simply type name in the Folder name field and it will create a folder with that name.
Carried Quota Model
The first model you need to create is the Carried Quota model. Its inputs are the Attainment factor, Quota, and New Revenue Required. Its outputs are Carried Quota, and Ramped Reps in Person Months. Below are some notes on each of the inputs and outputs.

Figure 6. Summary view of the Carried Quota model
Inputs
Attainment: Average quota attainment. You can input this manually based on calculations completed elsewhere in your business. If you have previously built and tracked targets in Fullcast, you could calculate your actual historical attainment on those targets.
Quota: Global average quota per month per rep. Again, if you have targets in Fullcast, you can calculate this using historical targets. If you put it in manually, you would just input your average rep per quota and divide by 12.
New Revenue Required: Your revenue goal for the year. Often, this is input manually based on direction from finance or other leadership. Once you have this number, you can create the schedule based on seasonality to spread it across the year.
Outputs
Carried Quota: How much quota, on average, each rep needs to carry. This is calculated by factoring together your new revenue required, average quota per rep, and attainment factor.
Ramped Reps (person months): How many people you need each month to hit your revenue goal.
How-to Documentation
Effective Headcount Model
The Effective Headcount model is the place where the bulk of the capacity planning work takes place. After you enter your inputs into the Effective Headcount model configuration, the main output shows up in a “Details” tab. In the details tab, you’ll find a table with all your headcount in the rows and their quotas broken down by month (or quarter) in the columns.

Figure 7.
Inputs
Current headcount: Current headcount provides the starting point for the model. You can either source this from the Teams module or use existing territory coverage assignments. Using the teams module is best practice.
Role and Ramp Profile: This section sets the assumptions that will be used for any to-be-hired reps. Although you choose one role here, you will be able to edit in the Details tab. For example, you can leverage multiple ramp profiles for your TBHs that you create.
Attrition: You can either pull this in manually or you can use any data available to calculate a historical value to use. For example, if you have fields on the user record that indicate terminations. You could calculate a historical number of terminations per year to project your attrition.
TBR Hire Lead Time: You can either enter this manually or you can use any data available to calculate a historical value to use.
Required Effective Headcount: This is where you will be able to use the Carried Quota Model’s “Ramped Reps” output to create the Goal for this input. Essentially, this number is the base number of fully ramped reps that you will require to hit the revenue goals. When you use the result of The Carried Quota Model, you are factoring in the average attainment, quota assumption, and revenue goal to get to the number of ramped reps. When you select the Carried Quota model's Ramped Reps input, it will automatically populate the same seasonality schedule that you created in that model. See Figure 8 below to see how to set up this input.

Figure 8.
Outputs
Snapshot: At the bottom of the Model page, you will have snapshot figures, broken down by month. This snapshot or summary will show you:
TBR Effective Replacements and Actual Replacements
TBH Effective Headcount and Actual Headcount
Effective Headcount - which is the total number of people per month that you need
Details: This is a table view that contains all of the headcount, their productivity and ramp assumptions, and the breakdown of the quota expectation per month. You can make individual or bulk adjustments directly within this table. This includes:
Edit Ramps and Productivity Profiles for current, TBH, and TBR headcount
Move headcount between teams
Manually adjust any quotas if needed
Next Steps
Once you have generated your initial model, you can iterate by:
Editing the details in the Effective Headcount model’s details tab
Editing the inputs in the Carried Quota model
Cloning your models and making alternative versions
If you change the inputs for the Effective Headcount model, when you go to the Details tab, you will see a yellow dot to prompt you whether you want to add/remove TBHs that would be required given the changes to your inputs.