Early access feature
This feature is currently available for early access. Contact your CSM for more information.
Use the report builder to pick the numbers, groupings, and report type for a dataset, then run and save the report. Start here once your dataset is set up.
Before you begin
Your dataset must be set up. Refer to Build a dataset in Reporting (Beta).
Find your way around the report builder
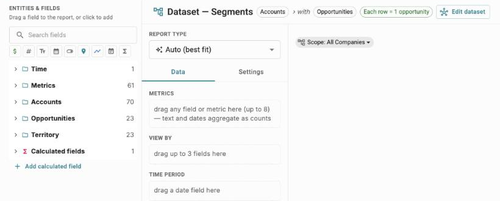
ENTITIES & FIELDS (left): every field in your dataset, grouped by record type, plus Time, Metrics (your tenant's saved metrics), and Calculated fields. Search, or filter by field type with the icons under the search box.
Dataset header (top): the record types in the dataset, the row badge such as Each row = 1 opportunity, and Edit dataset.
REPORT TYPE with the Data and Settings tabs (middle): what goes in the report and how it's shown.
Preview (right): the results after you click Run, with a Scope chip that shows which part of the hierarchy you're looking at.
Add metrics, groupings, and a time period
In ENTITIES & FIELDS, search for a field or expand a record type.
Drag the field onto a shelf on the Data tab, or click + next to it. Clicking + puts a number field on METRICS and a text field on VIEW BY.
Fill the shelves you need:
METRICS: up to 8 fields or saved metrics. Each one shows how it's totaled, such as Amount · sum. Text and date fields total as counts.
VIEW BY: up to 3 fields to group by, such as Territory name.
TIME PERIOD: a date field, when the report should cover a date window.
To remove a field, click the x on its chip. To add your own formulas, refer to Add calculated fields and measures in Reporting (Beta).
Choose a report type
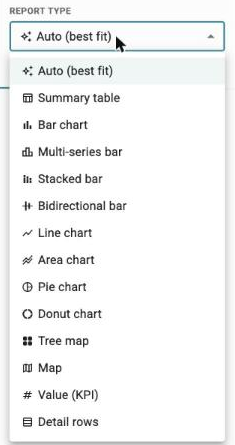
From REPORT TYPE, pick how to show the results. You can change the type at any time without rebuilding the report.
Report type | Use it for |
|---|---|
Auto (best fit) | Let the builder pick a type that fits your fields |
Summary table | Totals grouped by your VIEW BY fields |
Bar chart, Multi-series bar, Stacked bar, Bidirectional bar | Comparing totals across groups. Bar chart can be Vertical or Horizontal. |
Line chart, Area chart | Trends over time |
Pie chart, Donut chart, Tree map | Share of a whole |
Map | Totals by location |
Value (KPI) | A single headline number |
Detail rows | A row-by-row list of records |
Note
Auto (best fit) can pick a type you didn't expect, such as a map when a VIEW BY field looks like a place name. If that happens, choose the type yourself.
Sort, limit, and drill
On the Settings tab:
DRILL DOWN: keep No drill (keep current view), or pick a drill-down set up on the dataset. Refer to Set up drill-downs in Reporting (Beta).
SORT & LIMIT: choose the order, Descending or ascending, how many rows to show with Top (50 by default), and whether to Hide zero rows.
Run the report
Click Run.
Check the results in the preview.
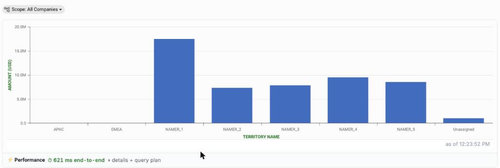
Under the results, Performance shows how long the report took end to end. Expand details + query plan to see what slowed it down. If you change anything after a run, the builder says Selections changed since the last run until you click Run again.
Save the report
A new report must run once before you can save it.
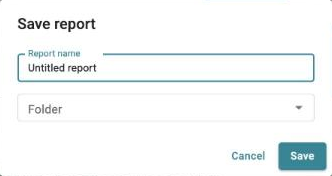
Click Save report….
Enter a Report name.
Pick a Folder. Leave it empty to save to Unfiled.
Click Save.
Your report is private to you until you share it.
Work with a saved report
Open a saved report from Reports (BETA). Use the hierarchy on the left to change which part of your plan the report covers. Click Edit to change it, or Exit to go back.
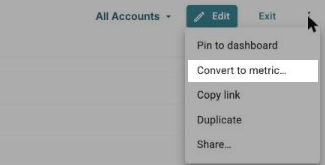
From the ⋮ menu, you can:
Pin to dashboard: add the report to a dashboard as a tile. Refer to Edit a dashboard in Reporting (Beta).
Convert to metric…: save a total from the report as a reusable metric, so everyone uses the same definition. Refer to Create and validate a metric in Reporting (Beta).
Copy link: copy a link to the report.
Duplicate: make a copy to change without touching the original.
Share…: give people or teams access. Refer to Share reports, dashboards, and folders in Reporting (Beta).