Early access feature
This feature is currently available for early access. Contact your CSM for more information.
Build a dataset to decide what each row of your report is and which related data it can use. Get this right first, because the dataset sets what every report on it can count, filter, and drill into.
Before you begin
A Tenant Admin must turn on Reporting (Beta) in Settings > Application Settings > Reporting with the Enable Reporting (Beta) toggle.
Decide what you want to count, such as opportunities, accounts, or people. That choice drives every step below.
Choose what each row should be
A dataset works like a spreadsheet. You pick what one row stands for, and every report you build on the dataset counts and totals those rows.
In the top navigation, click Reports (the item with the BETA badge).
Click Add New > Report.
Under Start with what each row of your dataset should be, select a starting point.
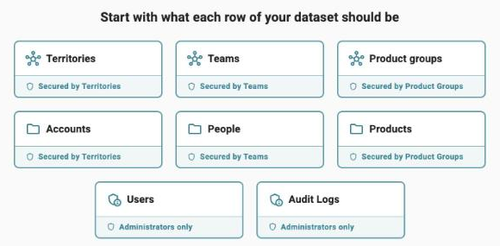
Starting point | Each row starts as | Who sees which rows |
|---|---|---|
Territories, Teams, Product groups | A node in that hierarchy | Secured by that hierarchy |
Accounts | An account | Secured by Territories |
People | A person | Secured by Teams |
Products | A product | Secured by Product Groups |
Users, Audit Logs | A user or an audit log entry | Administrators only |
"Secured by" means each person sees only the rows in their own part of that hierarchy. Two people can run the same report and see different totals.
The first card appears on the canvas with a count of what's in your scope, such as 12 territories in your scope.
Add related data
Related data brings another record type into the dataset, such as the opportunities on each account.
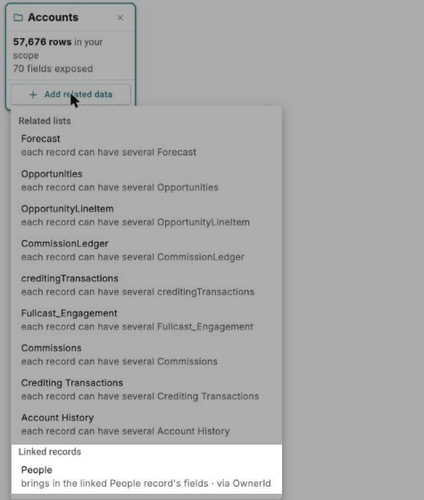
On a card, click Add related data.
Pick a record type from Related lists or Linked records.
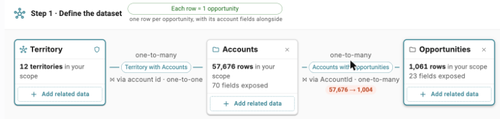
Repeat on the new card to go another level down, such as Territory > Accounts > Opportunities.
Type | What it does | Example |
|---|---|---|
Related lists (one-to-many) | Each record can have several of these. Adding one usually changes the row to the more detailed record. | Accounts > Opportunities: each row becomes one opportunity, with its account fields alongside. |
Linked records (one-to-one) | Brings in the fields of one linked record through an ID field. The row stays the same. | Accounts > People via OwnerId: each account row gains its owner's fields. |
The options come from the relationships set up for your tenant, so you might see custom objects in the list too.
Check what each row is
Next to Step 1 · Define the dataset, a badge tells you what each row is right now, such as Each row = 1 opportunity. Check it after every change. The line under each join shows how many rows of the card on the left the join keeps, such as 57,676 → 1,004.
Caution
When each row is an opportunity, an account field repeats on every one of that account's opportunity rows, so summing an account field such as annual revenue overstates it. Total the fields that belong to the record each row represents.
Choose with, with or without, or without
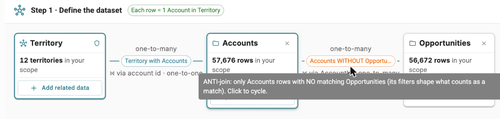
The label on each join decides which records stay in the dataset. Click the label to cycle through the three options.
Label | What stays | Use it to |
|---|---|---|
Accounts with Opportunities | Only accounts that have at least one matching opportunity | Report on opportunities, where every opportunity needs an account |
Accounts with or without Opportunities | Every account, with opportunity data where a match exists | Keep every account in view, even ones with no deals |
Accounts WITHOUT Opportunities | Only accounts with no matching opportunity. The opportunity card shows Excluded (WITHOUT) and each row goes back to being an account. | Find gaps, such as accounts with no pipeline |
Filters on the related card shape what counts as a match. For example, if the Opportunities card keeps only open opportunities, WITHOUT finds accounts with no open opportunities.
Pick the fields people can use
By default, every field on a record type is available in the report builder, including fields added later. Limit the list when other people will build on this dataset, or when it includes sensitive data such as commissions.
Click a card to open its Configure panel.
Under Available fields, choose All fields (new fields included automatically) or Restricted — only the fields I pick.
If you chose Restricted, select the fields to expose.
Filter the dataset
Filters on a card decide which records exist in the dataset at all. Each card has its own filters.
Click a card to open its Configure panel.
Under Filter, click + and choose Add Condition, or Add Group to mix And with Or.
Pick the field, the operator, and the value. For example, IsClosed Equals false keeps open opportunities only.
Optional: under Time filters (fiscal-aware), click Add time filter, pick a Date field, and set the Condition.
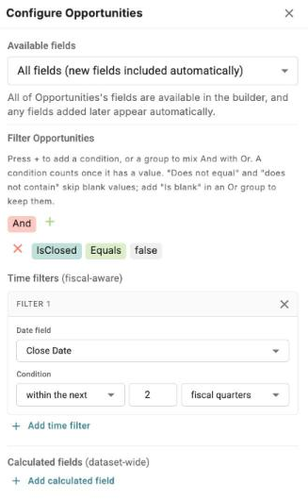
Time filter conditions are within the last, within the next, more than … ago, is before, is after, is between, and is (period). Units include days, weeks, months, quarters, years, fiscal quarters, and fiscal years. Relative windows such as "within the next 2 fiscal quarters" are worked out each time the report runs, not when you build it.
A condition counts only once it has a value. Does not equal and does not contain skip blank values. To keep blanks, add Is blank in an Or group.
Caution
Dataset filters limit every report built on the dataset. If the dataset keeps only deals closing in the next two fiscal quarters and a report asks for last quarter, the report comes back empty.
Add calculated fields and drill-downs
Two more settings live on the dataset:
Calculated fields (dataset-wide): add a formula value to every row, such as days to close. Refer to Add calculated fields and measures in Reporting (Beta).
Drill-downs: let people click a value in a report to zoom into the next level. Refer to Set up drill-downs in Reporting (Beta).
Continue to the report builder
Check the row badge one last time.
Click Continue to report builder.
You can come back to the dataset at any time with Edit dataset in the report builder. To build the report itself, refer to Build and save a report in Reporting (Beta).