Coverage reports streamline the review of assignment of people to territories, including aspects of their roles, the assignments themselves, and the territory structure. It's a tabular view of these three components of your territory coverage.
Coverage report scenarios
Refer to the following examples of coverage report scenarios and their configuration:
Active territory coverage
Check which territories have coverage assignments for a specific role. Nodes without coverage assigned to the specified role will not show up in the report. .png)
Field | Configuration |
|---|---|
Columns |
|
Filters |
|
Inactive users with active coverage assignments
View active coverage assignments for scenarios where someone is inactive in Salesforce (leaves the business) but their assignments are still active in Fullcast.
.png)
Field | Configuration |
|---|---|
Columns |
|
Filters |
|
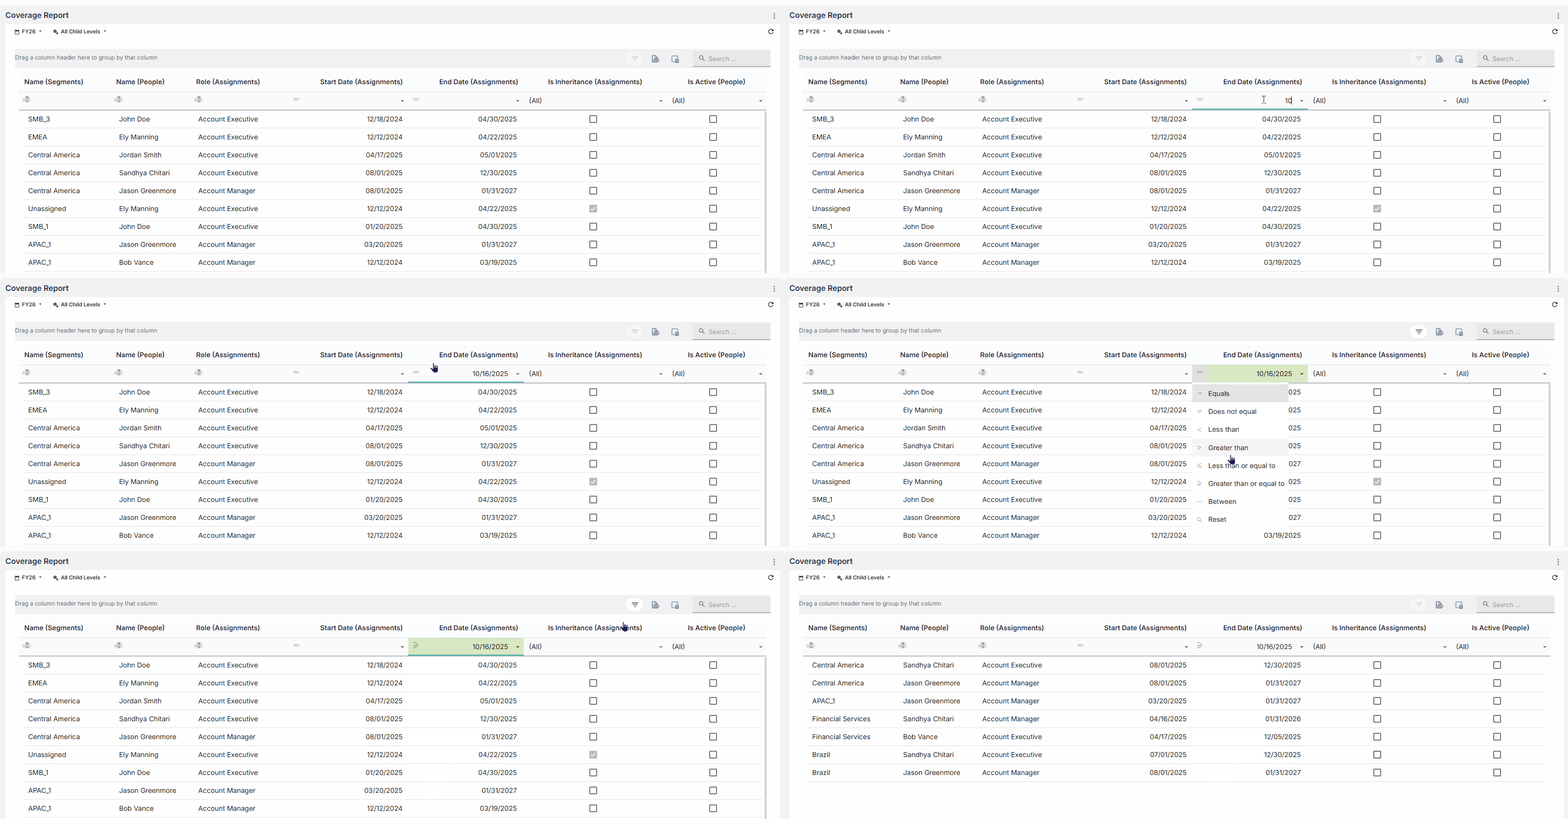
Note
Use a filter to narrow the end date.
Under the column header, type in the date you want to filter by.
Click the operator menu on the left side of the column and select the operator you want to filter by.
Click filter in the gray bar above the header row.
Design a coverage report
In the chart designer, select Coverage Report from the right menu.
In the Chart Title field, type a unique name for the chart.
Note
If you don’t provide a name, the chart will populate a name.
Configure the following fields:
Columns
Select people-based entities like assignments, people, roles, and territory that will display in columns on the table of the coverage report.
From the Entities menu on the left, search for dimensions and measures.
Drag and drop dimensions and measures to the Columns field.
Filters (optional)
Add criteria to customize the filters for the data.
From the Entities menu on the left, search for dimensions and measures.
Drag and drop dimensions and measures to the Filters field.
In the Operator field, select the condition to filter the data by.
In the Value field, add the value to filter the data by.
Click Plot.
