Fullcast provides powerful reporting tools geared toward the needs of your go-to-market strategy and operations functions. Reports in Fullcast allow you to view data broken down according to the way you go to market. As you click through territories, the data will refresh for each particular segment.
Data sources and types
When you build reports, understand where the data is coming from and what types of data you can access.
Data sources
All the potential sources of data that you can leverage through Fullcast’s charts include:
Raw entities—data imported from various lines of business applications or transaction (OLTP) systems, such as a CRM, financial, or point of sale system into the design application to use for planning.
Go-to-market entities—data that is created within the design module, such as territories, assignments, targets, and custom metrics.
For more information on importing entities into Fullcast, refer to Creating a New Entity in Fullcast.
Data types
The Basic and GTM chart types organize data according to the entity, object, then dimensions and measures:
Dimensions—qualitative values (such as names, labels, regions, or dates) used to categorize, segment, and reveal the details in your data. Dimensions affect the level of detail in the view and appear on your x-axis.
Measures—numeric or quantitative values (such as sales revenue) used to measure, aggregate (sum, average, and so on), and use in mathematical functions. Measures appear on your y-axis.
Analytical tools
Customize your data for analysis in various ways, expand each section to read more on different report aspects:
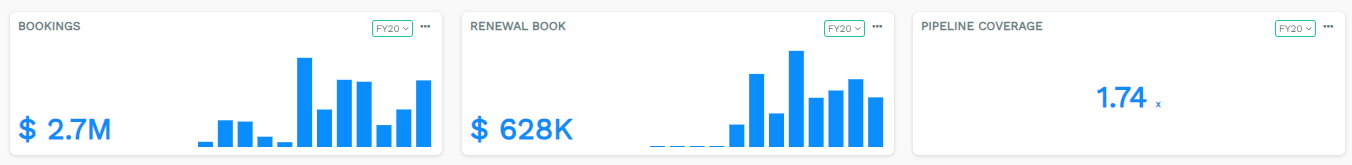
Summary metrics
Summary metrics are calculated fields that leverage both GTM entities and raw entities. These are constructed based on your own needs to reflect specific key performance indicators (KPIs) that your organization tracks. Some common summary metrics include number of accounts, ARR, and bookings potential.
Refer to Summary Metrics and Add Metrics to the Summary Panel for more information.
Charts
Charts provide a lot of flexibility to bring together the data you need to answer specific questions. You can build robust graphs or tables and customize them to meet your needs. When you select a graph presentation, you can select which axis each dimension or measure is on, time periods, and more. You can also select to view the data in a table.

Reports
Reports are geared to a more specific strategic task. They have fewer inputs and provide a bit more guidance on what they can do.
For visual examples of reports and charts, refer to Chart types.
Chart and report types
You have the option to customize eleven different types of reports to analyze your data:
Basic chart
GTM chart / table
Coverage report
Portfolio report
Disruption report
Comparison chart
Attainment chart
Data Quality chart
Map chart
Configure data
In addition to selecting dimensions and measures, there are a few more aspects of a chart that define the data being used:
Constraint | Description |
|---|---|
Timeline | The timeline constraints the measures plotted in the chart by a specific time period. This field is auto-populated when you add a time-series measure.
|
Filters | Filters restrict the data shown in the chart to match the conditions you specify. You can add multiple rows to filter in the Chart Builder. |
Limits | Limits restrict the number of dimensions plotted in the graph. For example, if you're sorting by Territory name and only want to plot five territories, you can set the limit value as |
Customize measures
Configure the following attributes on your measures:
Attribute | Description |
|---|---|
Aggregation | Aggregate the measure for each group—select between sum, avg, count (distinct count for dimensions), min, and max. |
Axis | Display measures with different units using different y-axes—select between primary or secondary. |
Sort Order | Plot measure values in ascending or descending order. If there are multiple sort orders specified, only the first one is used. |
Type | Select the chart type from the following options—bar, line, area, and stack. |
Color | Use the fullcast.io color palette to customize the graph color for each measure. |
Access reports and dashboards
There are a couple different places to view reports in Fullcast. While the motion module allows you to access all of our charts and report types and pin them to dashboards, the design module also provides important reporting capabilities.
In the Reports module—the primary place for viewing data for analysis where you can create dashboards that bring together all the variety of charts, reports, and summary metrics available in Fullcast.
In the Territories module—you can use the balancer tab to create GTM charts specifically geared toward viewing and tweaking the balance of territories during the territory planning process. Additionally, you can pin summary metrics to your view in the territory designer.