Filter reports by timeseries, drill down node levels, filter on a specific person, account, or product.
Filter by timeseries
Filter all reports on a dashboard by a specified period of time.
Go to Reports.
Select the folder for the report you want to view.
Find the dashboard you want to view.
From the timeseries dropdown, select the the period of time you want to view report data for:
.png)
Fiscal Year: Selected fiscal year.
Trailing: Past number of days selected to the current date.
To Date: Start of the last month, quarter, or year to the current date.
This: Current month, quarter, or year.
Last: Last month, quarter, or year.
Next: Next month, quarter, or year (estimated).
Custom: Select the date range to filter data on.
Filter on a person, account, or product node
Filter all reports on a dashboard by a person, account, or product. The filter options are determined by the data source for the dashboard (Teams, Products, Segments).
Go to Reports.
Select the folder for the report you want to view.
Find the dashboard you want to view.
From the (All People, All Accounts, All Products) dropdown, select the person, account, or product you want to filter reports on.
.png)
Note
If data is not available for a specific report on the dashboard it will display not available on that report.
Filter by node level
Select to filter individual reports by node level.
Go to Reports.
Select the folder for the report you want to view.
Find the dashboard you want to view.
Find the report you want to filter.
Click the level filter dropdown and select one of the following:
.png)
All Child Levels: includes all child nodes under the top selected node.
Next Level Only: includes the next level from the selected node.
Selected Level (default): includes the selected node.
Table filters
Use the different filtering options on a table to customize your view of the data:
Use the column search field to filter table data by search terms.
Click on the search field at the top of the column.
Type your search criteria.
Note
The table dynamically filters data based on related letters as you type.
Use the sort and arrange feature to organize the data in the transactions table, as needed.
Click on the column title to sort the table by ascending ↑ or descending ↓ alphabetical order in the column.
Drag column headers in the order you want them to display in the table.
Use the group by feature to change how you view the transaction data based on selected groupings.
Drag and drop column headers from the table to the group by field to group the data in the table based on the selected columns.
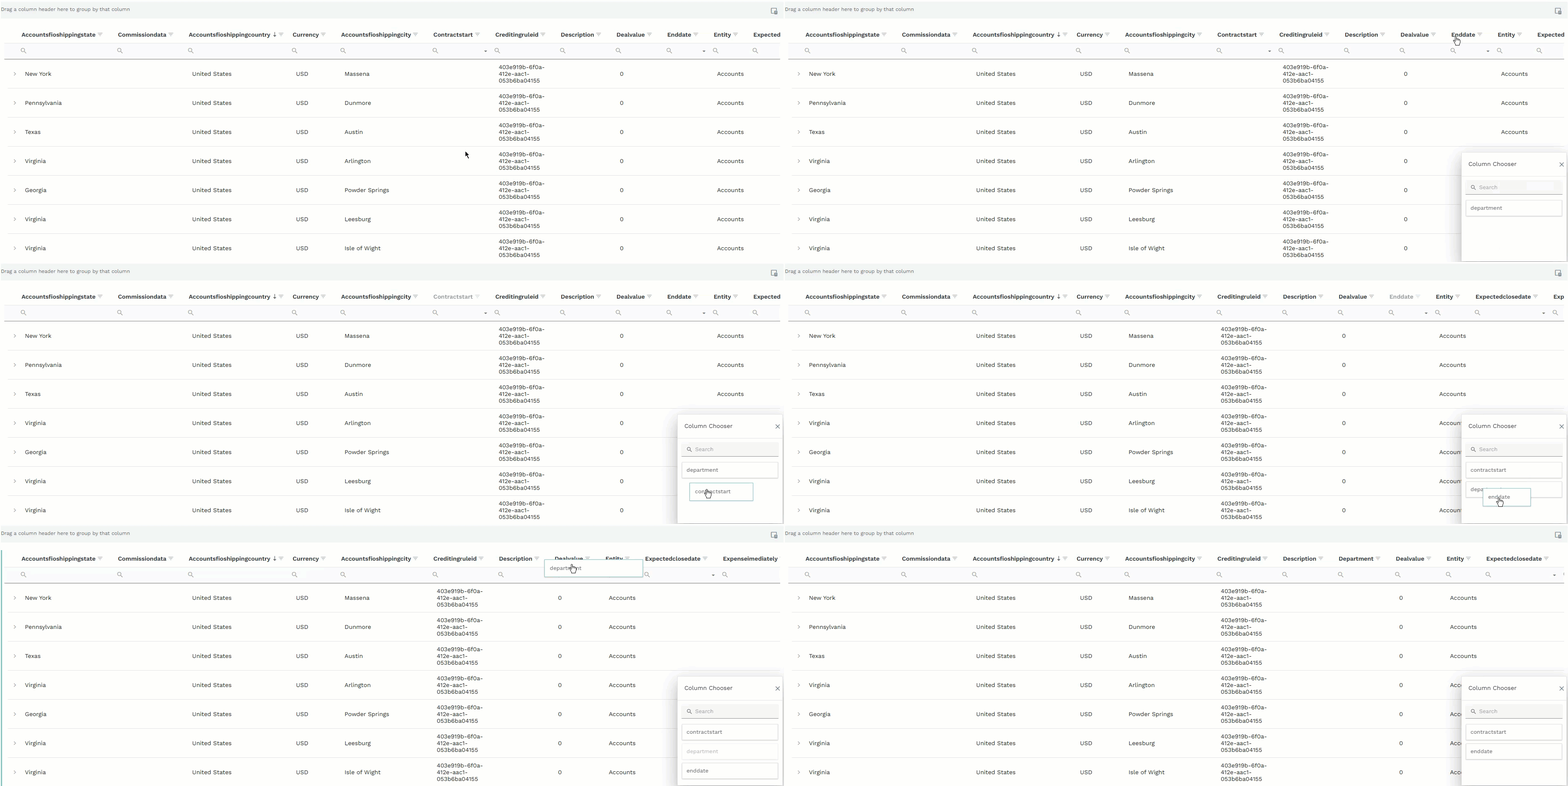
Use the Column Chooser to customize what column data displays in the transactions table.
Click Column Chooser.
Drag and drop column headers to and from table and the Column Chooser window.
Use the refresh option to ensure you are viewing the latest data.
Click Refresh.
Note
The table may take a few seconds to pull in the latest data and reload.


