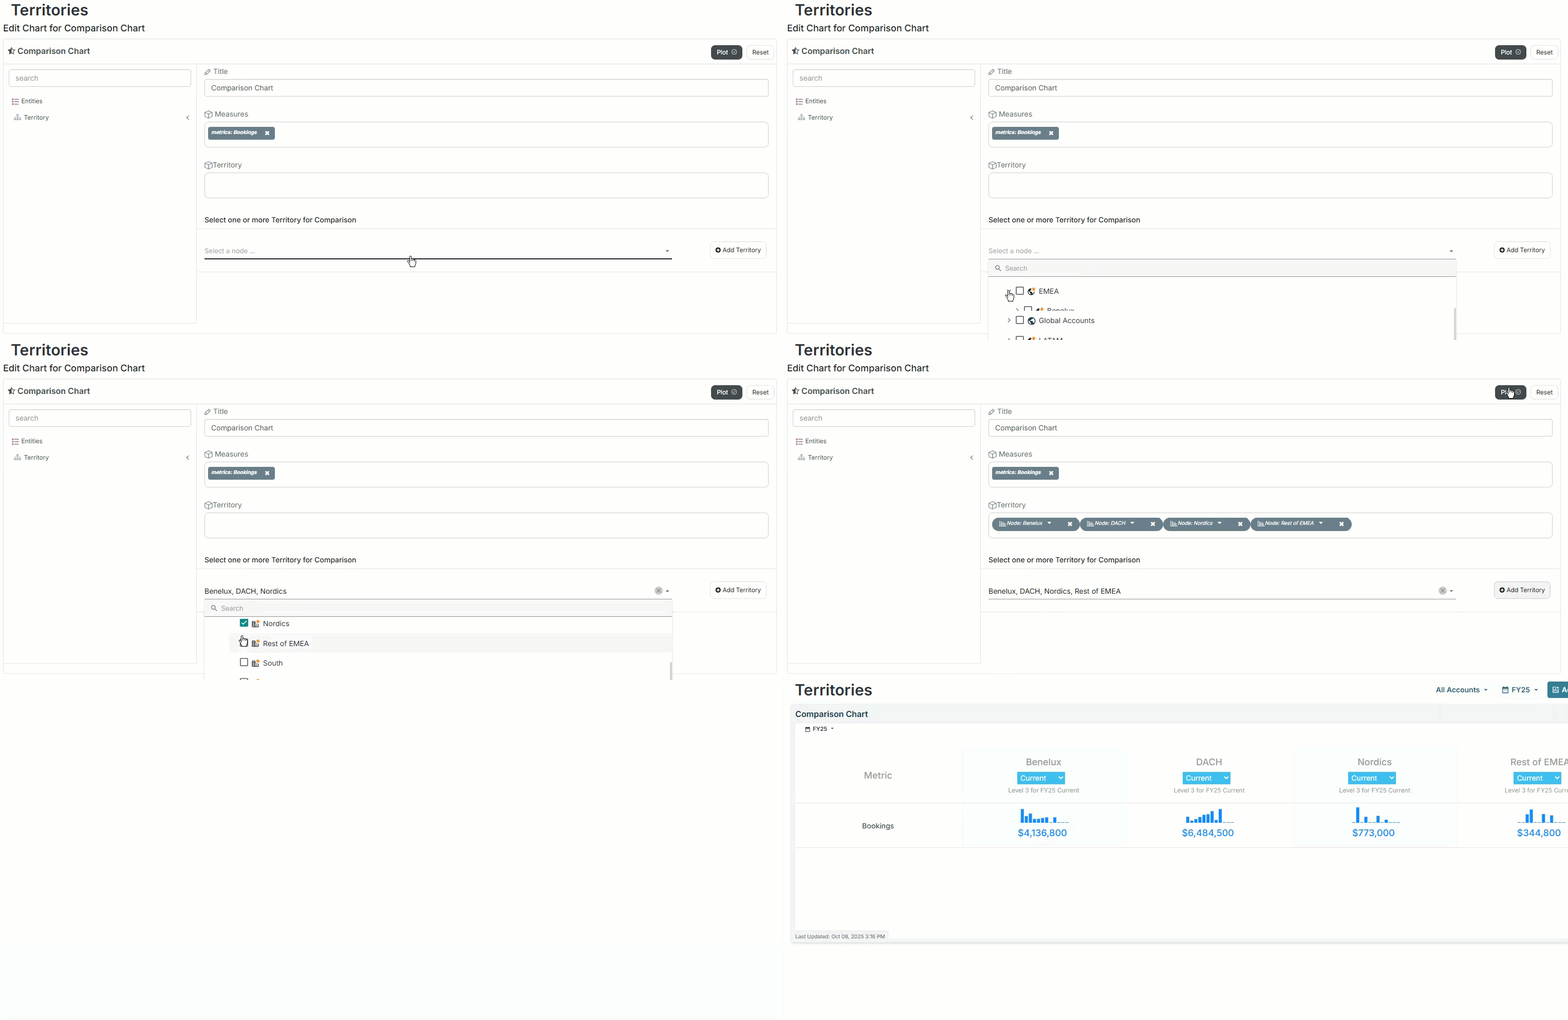
The comparison chart displays a comparison of nodes based on a selected measure (employee’s sales quotas, number of bookings per territory).
Design a comparison chart
In the chart designer, select Comparison Chart from the right menu.
In the Title field, type a unique name for the chart.
Note
If you don’t provide a name, the chart will populate a name.
Configure the following fields:
Measures
Select a measure you want to use to compare the entities.
From the Entities menu on the left, search for a measure.
Drag and drop the measure to the Measures field.
Territory | Product | Employees
This section depends on the data source you are building the report from (teams, territories, products).
From the dropdown below the section, select one or more nodes you want to compare.
.png)
Click Add.
Click Plot.
