The attainment report provides insights into how well you are meeting goals in various areas. This report can be used in both the territories and teams sections. Here are six common scenarios where you can use this report.
Target and Attainment by Current Node
This use case outlines the parameters for showing the performance of a specific metric against defined targets over a period of time.
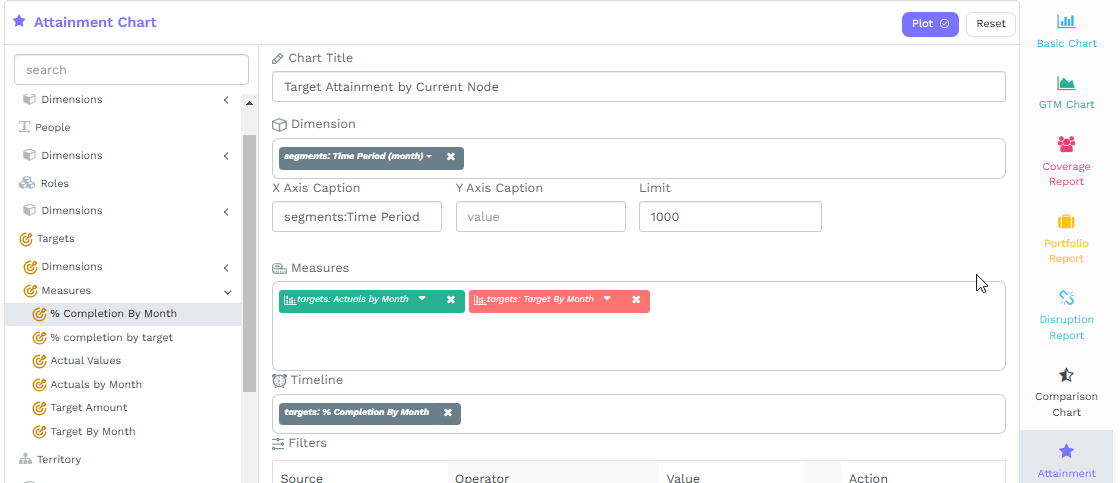
Figure 1 Attainment by Current Node
Access your Fullcast instance and switch plans if applicable.
Navigate to the appropriate node and click the “Actions” button in the top right corner.
Select “Create a Chart” from the dropdown and click “Attainment Chart” on the right panel.
Expand “Dimensions” beneath the “Territory” option.
Drag and drop the “Time Period” dimension into the “Dimensions” field.
Expand the “Measures” beneath the “Targets” option.
Drag and drop the “Actuals by Month”, and “Target by Month” measures into the “Measures” field.
Select the appropriate target from the dropdown menu and click “Confirm.”
Drag and drop the “% Completion by Month” option into the “Timeline” field.
Add filters if applicable.
Click the “Plot” button.
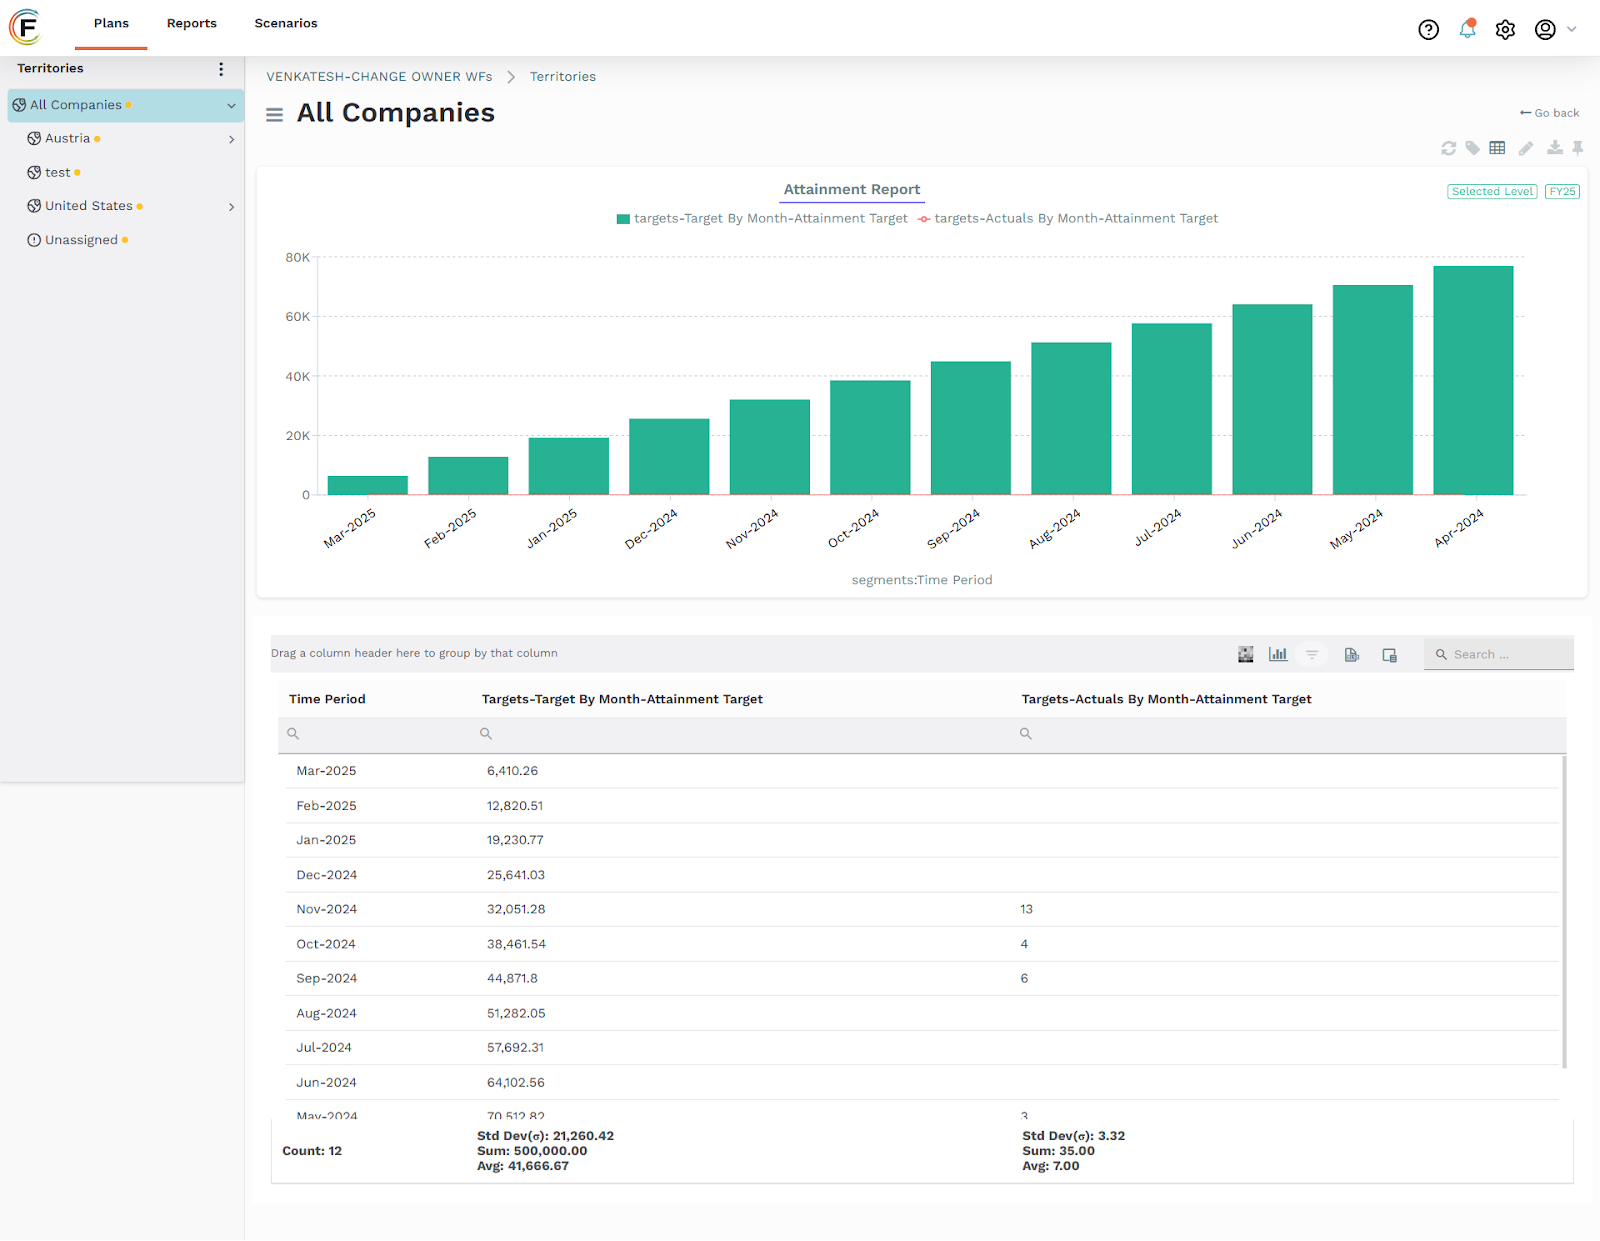
Figure 2 Example Chart
Role-Based Target Association
This use case aims to identify and display all individuals linked to a specific target through role assignments. By associating targets with roles and assigning people to these roles, we can visualize a comprehensive network of individuals connected to a particular target.
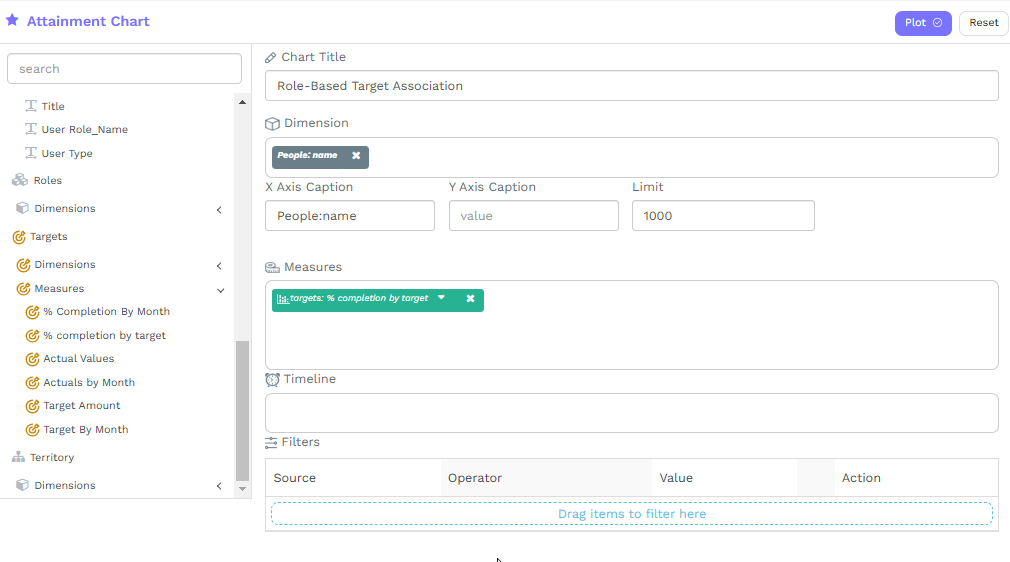
Figure 3 Role-Based Target Configuration
Access your Fullcast instance and switch plans if applicable.
Navigate to the appropriate node and click the “Actions” button in the top right corner.
Select “Create a Chart” from the dropdown and click “Attainment Chart” on the right panel.
Expand “Dimensions” beneath the “People” option.
Drag and drop the “Name” dimension into the “Dimensions” field.
Expand “Measures” beneath the “Targets” option.
Drag and drop the “% complete by target” measure into the “Measures” field.
Note:
Apply the “isLeaf” filter with a value of “TRUE” when using the “Next Level” or “All Levels” options.
Click the “Plot” button.
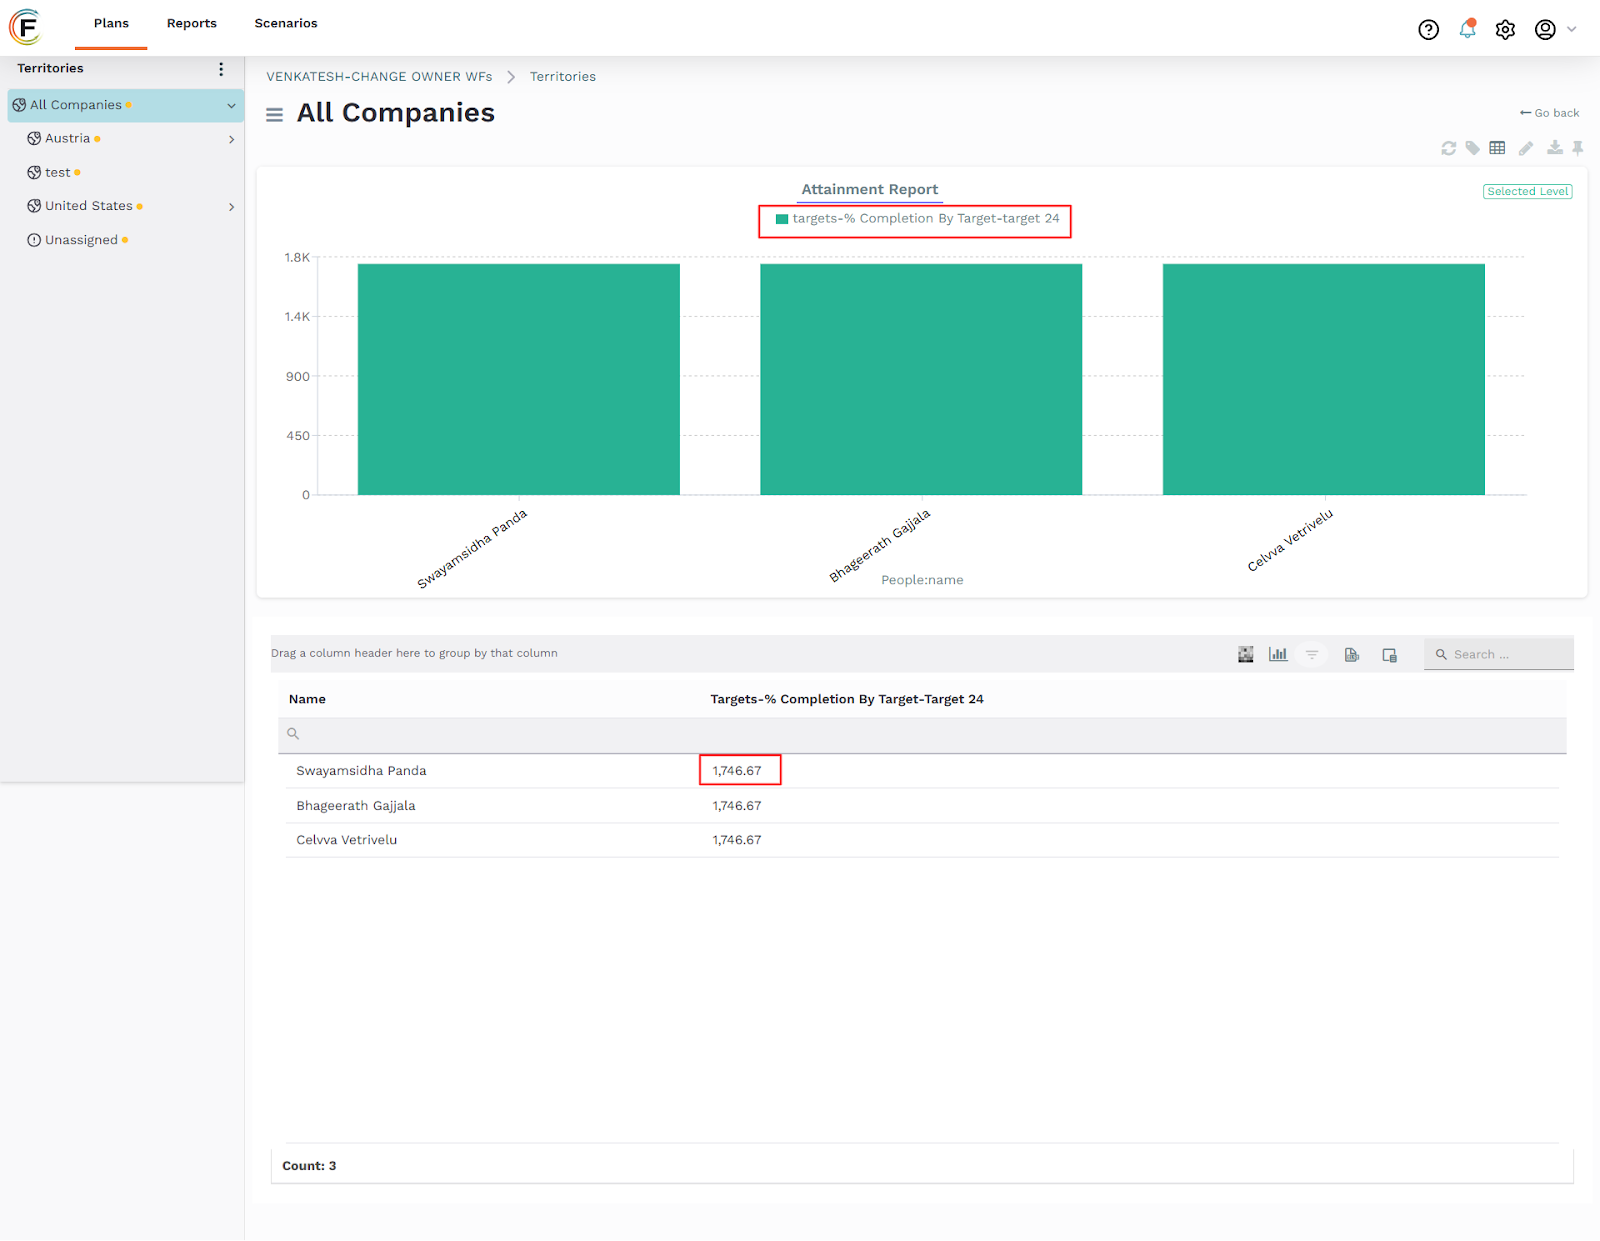
Figure 4 Example Chart
Attainment by Person - Teams Module
This use case aims to identify and display all individuals directly and indirectly linked to specific targets. For direct targets (person-level), Fullcast associates individuals with the target. For indirect targets (higher-level), Fullcast identifies individuals through role-based assignments.
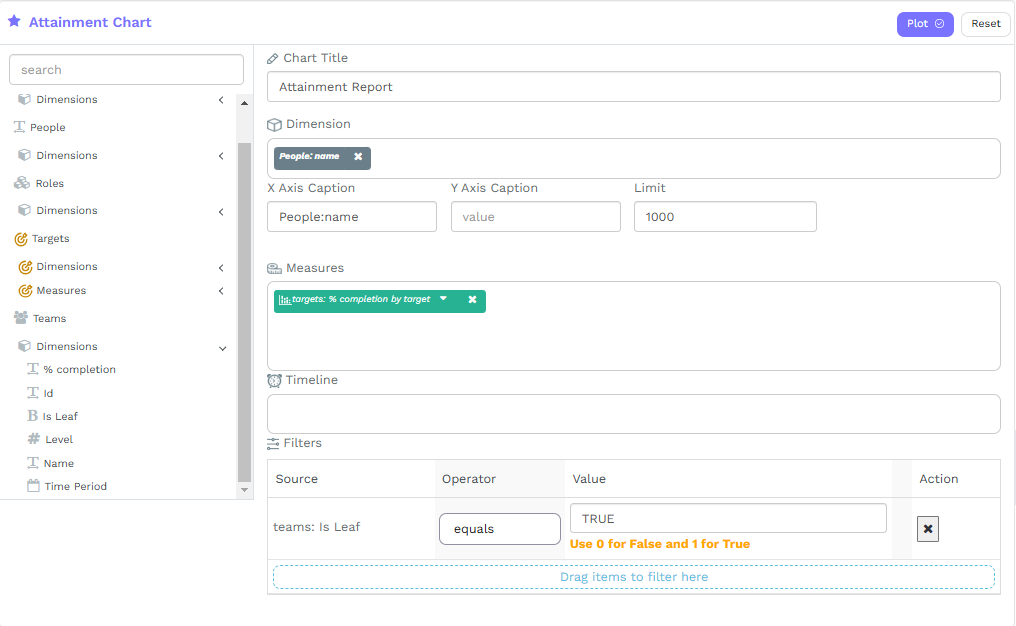
Figure 5 Attainment by Person
Access your Fullcast instance and switch plans if applicable.
Navigate to the appropriate node and click the “Actions” button in the top right corner.
Select “Create a Chart” from the dropdown and click “Attainment Chart” on the right panel.
Expand “Dimensions” beneath the “People” option.
Drag and drop the “Name” dimension into the “Dimensions” field.
Expand “Measures” beneath the “Targets” option.
Drag and drop the “% completion by target” into the “Measures” field.
Note:
Apply the “isLeaf” filter with a value of “TRUE” when using the “Next Level” or “All Levels” options.
Click the “Plot” button.
Attainment by Percent Completion
This use case provides a visual representation of target attainment by percentage completion.
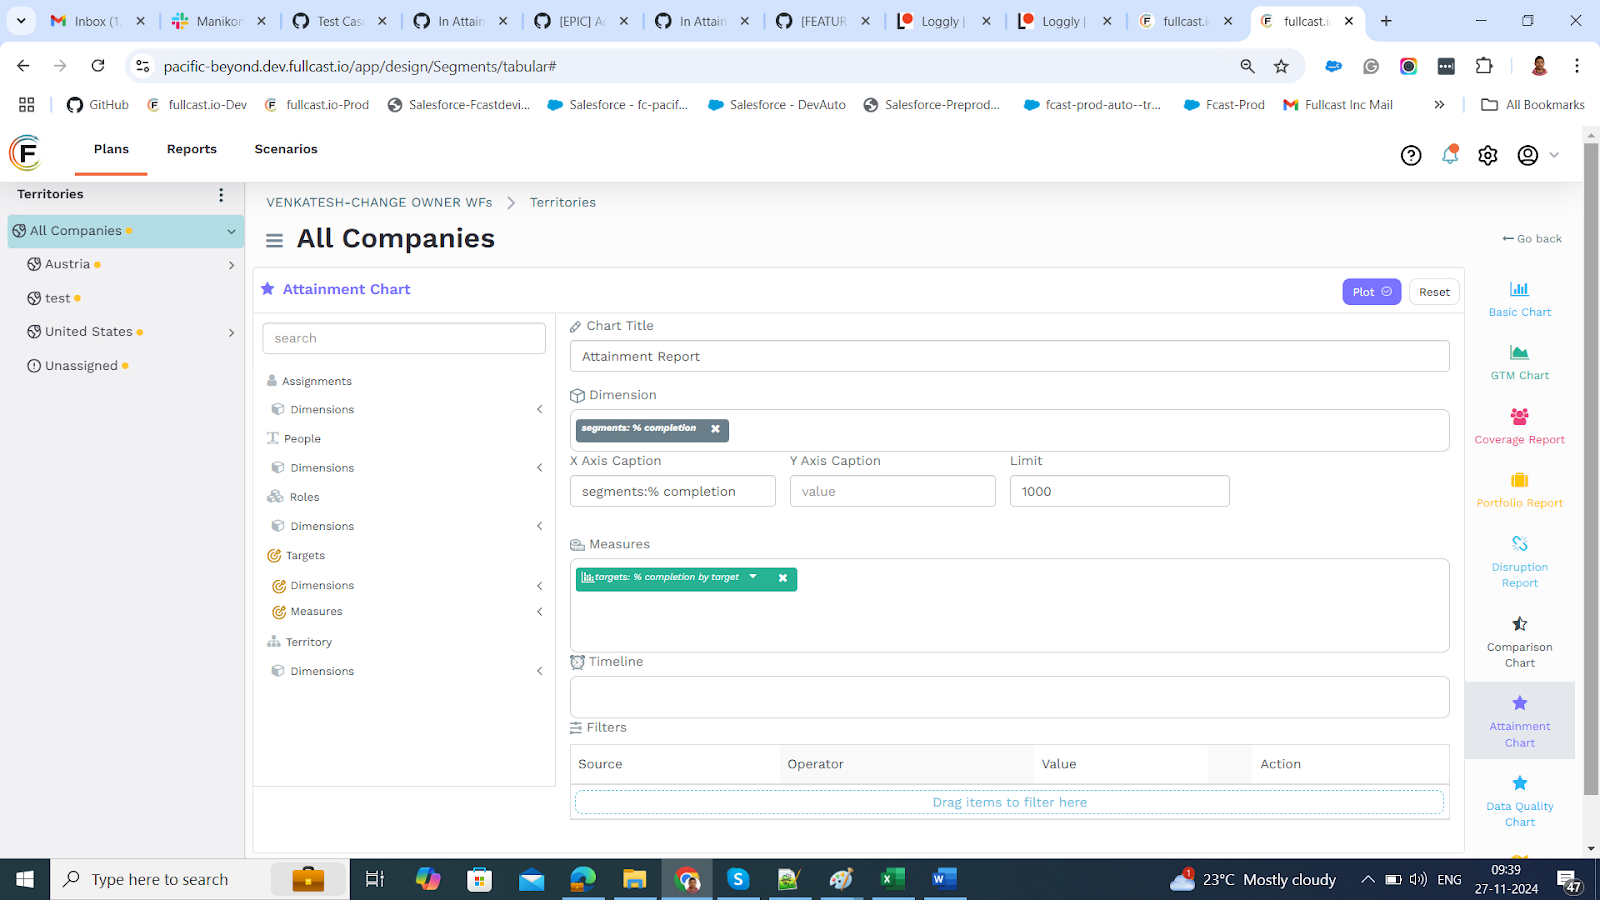
Figure 6 Attainment by Percent Completion
Access your Fullcast instance and switch plans if applicable.
Navigate to the appropriate node and click the “Actions” button in the top right corner.
Select “Create a Chart” from the dropdown and click “Attainment Chart” on the right panel.
Expand “Dimensions” beneath the “Territory” option.
Drag and drop the “% completion” dimension into the “Dimensions” field.
Expand “Measures” beneath the “Targets” option.
Drag and drop the “% completion by target” measure into the “Measures” field.
Note:
Apply the “isLeaf” filter with a value of “TRUE” when using “Next Level” or “All Levels” options.
Click the “Plot” button.
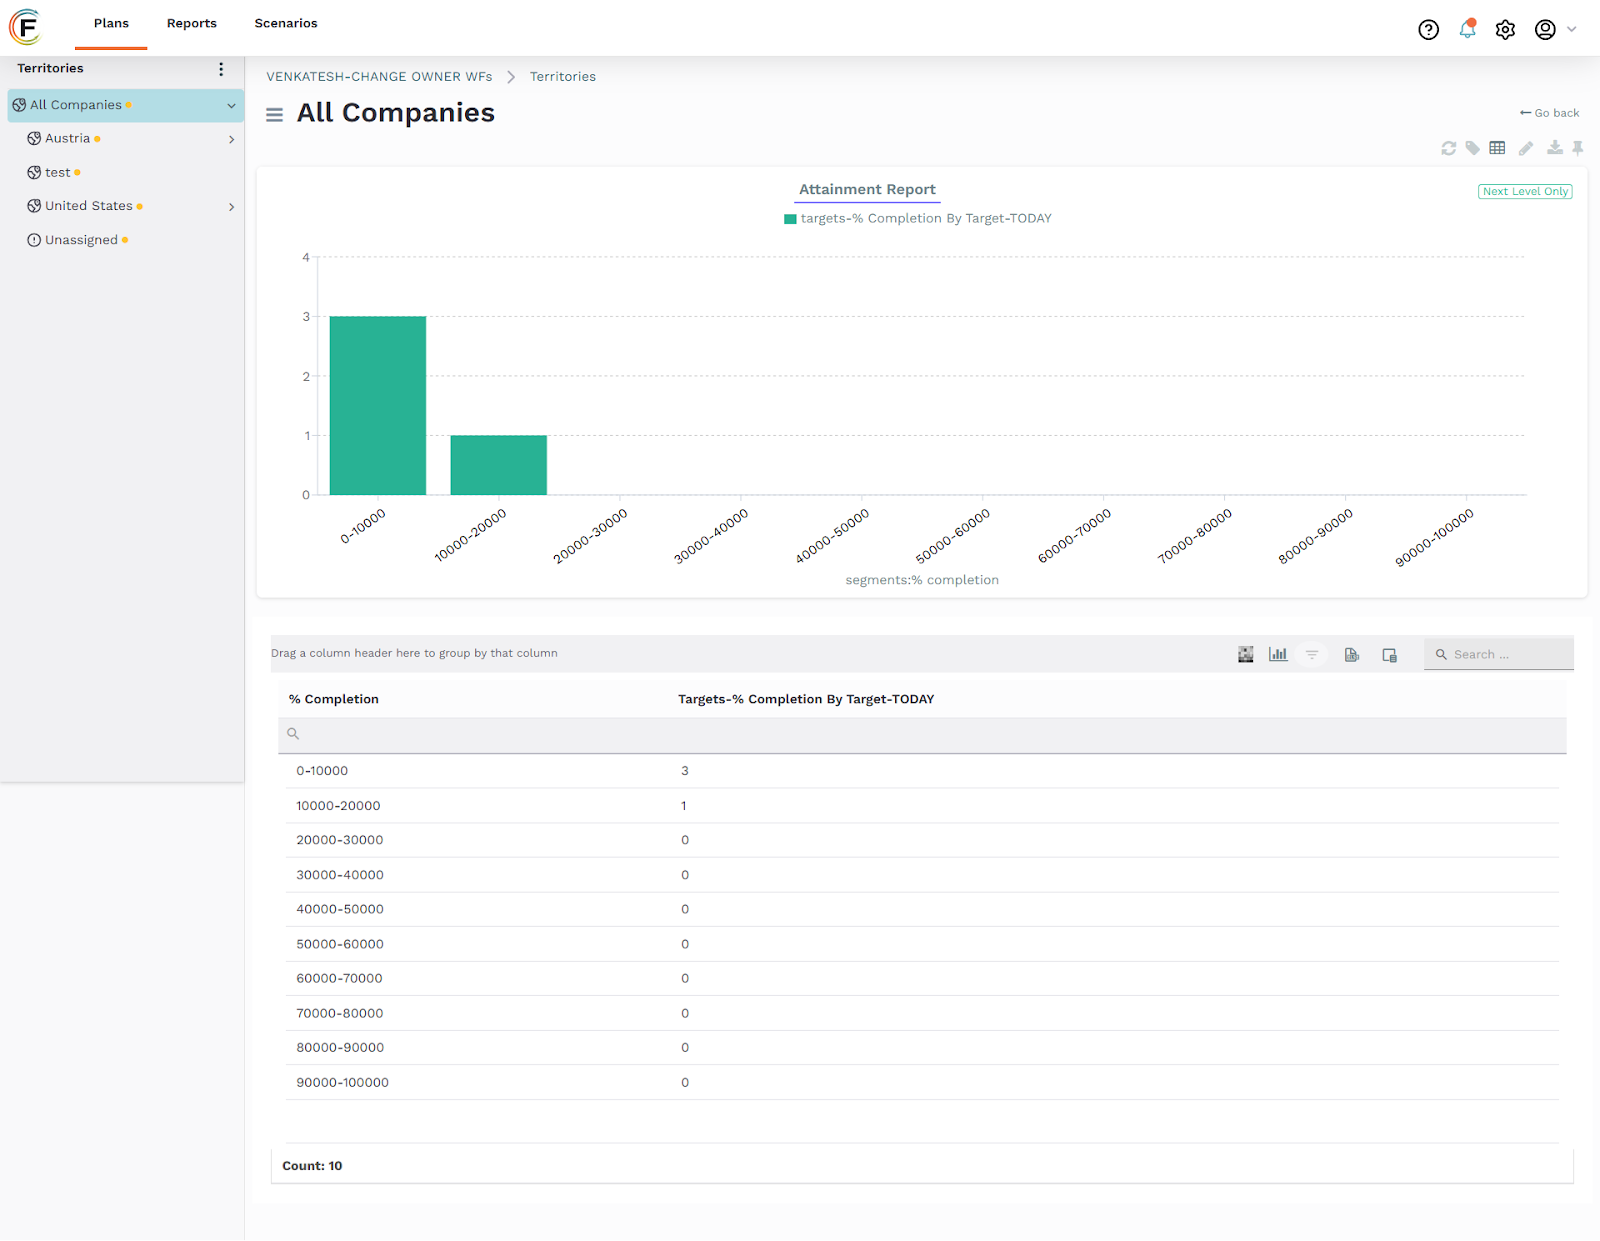
Figure 7 Example Chart
Target Amount Carried by TBx Users
This use case aims to visualize the distribution of target coverage across different assignment types (TBH, TBT, TBR). The chart will highlight the portion of the tar g et that remains unassigned.
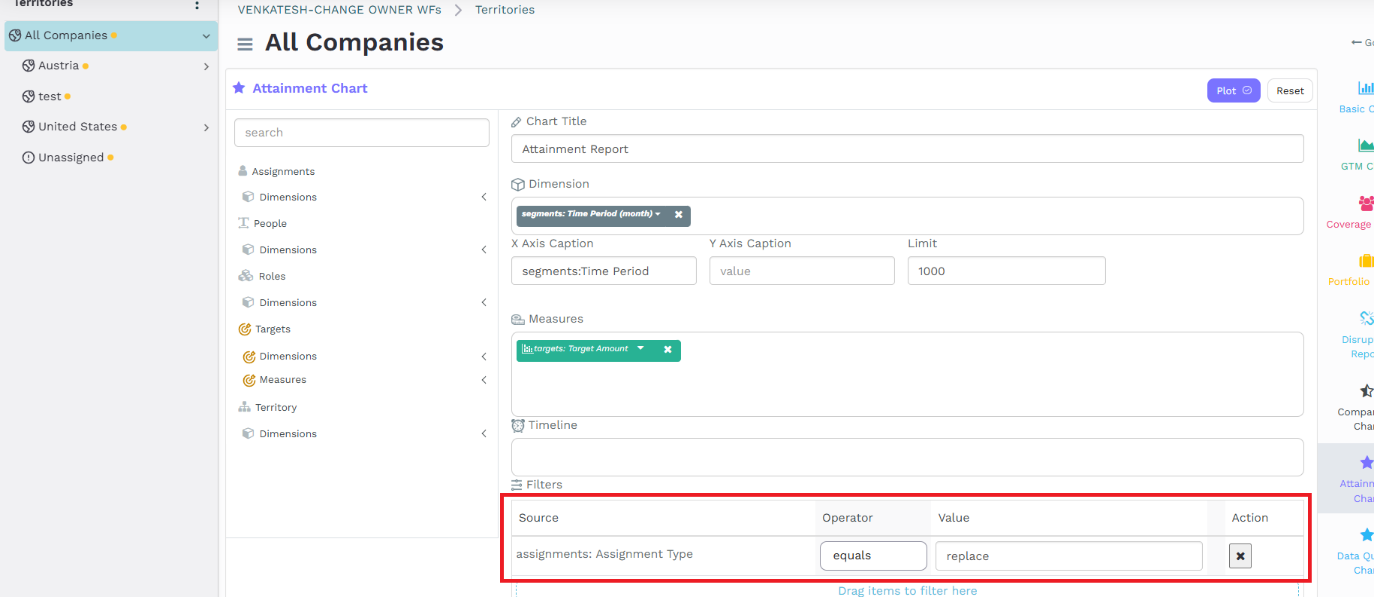
Figure 8 Target Amount Carried by TBx Users Settings
Access your Fullcast instance and switch plans if applicable.
Navigate to the appropriate node and click the “Actions” button in the top right corner.
Select “Create a Chart” from the dropdown and click “Attainment Chart” on the right panel.
Expand “Dimensions” beneath the “Territory” option.
Drag and drop the “Time Period” dimension into the “Dimensions” field.
Expand “Measures” beneath the “Targets” option.
Drag and drop the “Target Amount” measure into the “Measures” field.
Note:
Apply the “isLeaf” filter with a value of “TRUE” when using the “Next Level” or “All Levels” options.
Click the “Plot” button.
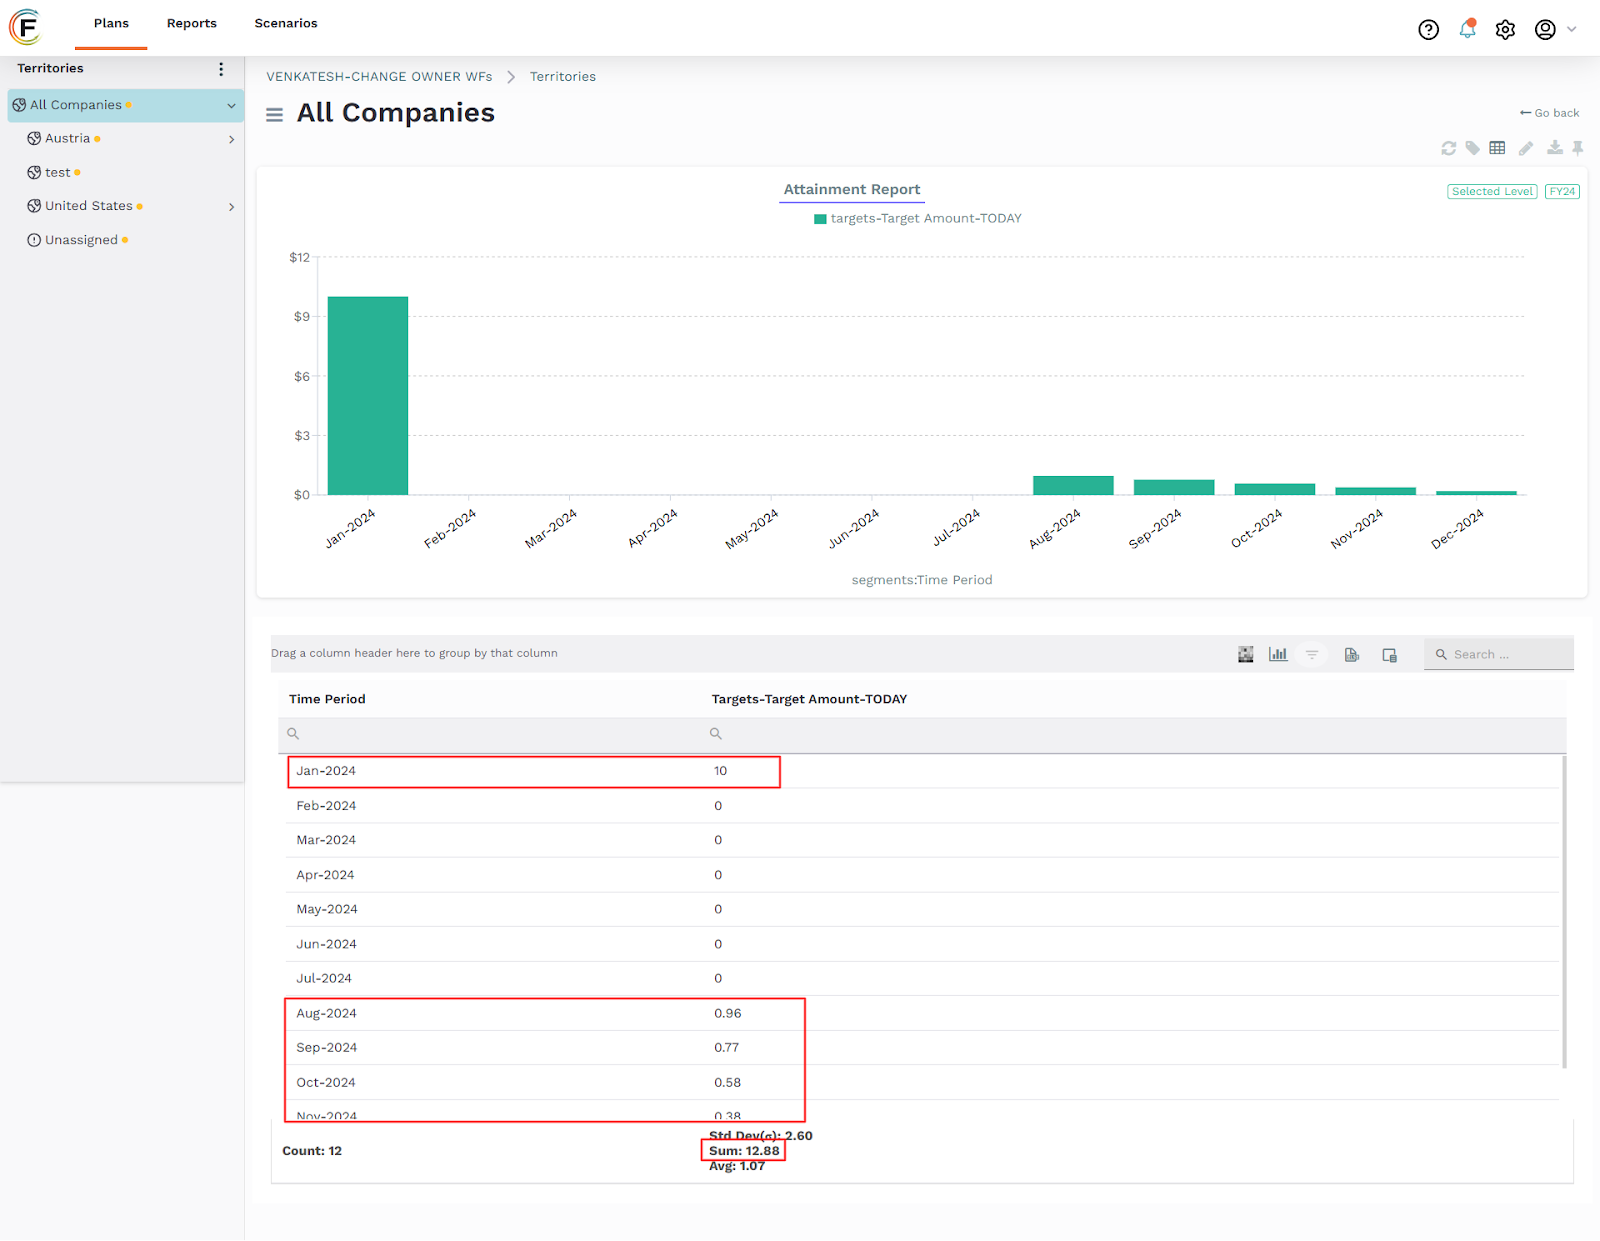
Figure 9 Example Chart
Amount of Target - No Coverage
This use requires a chart to illustrate the amount of the target that has not been assigned to individuals in TBH, TBT, or TBR roles. By identifying the portions without coverage, Fullcast can understand the gap in resource allocation and potential areas for improvement.
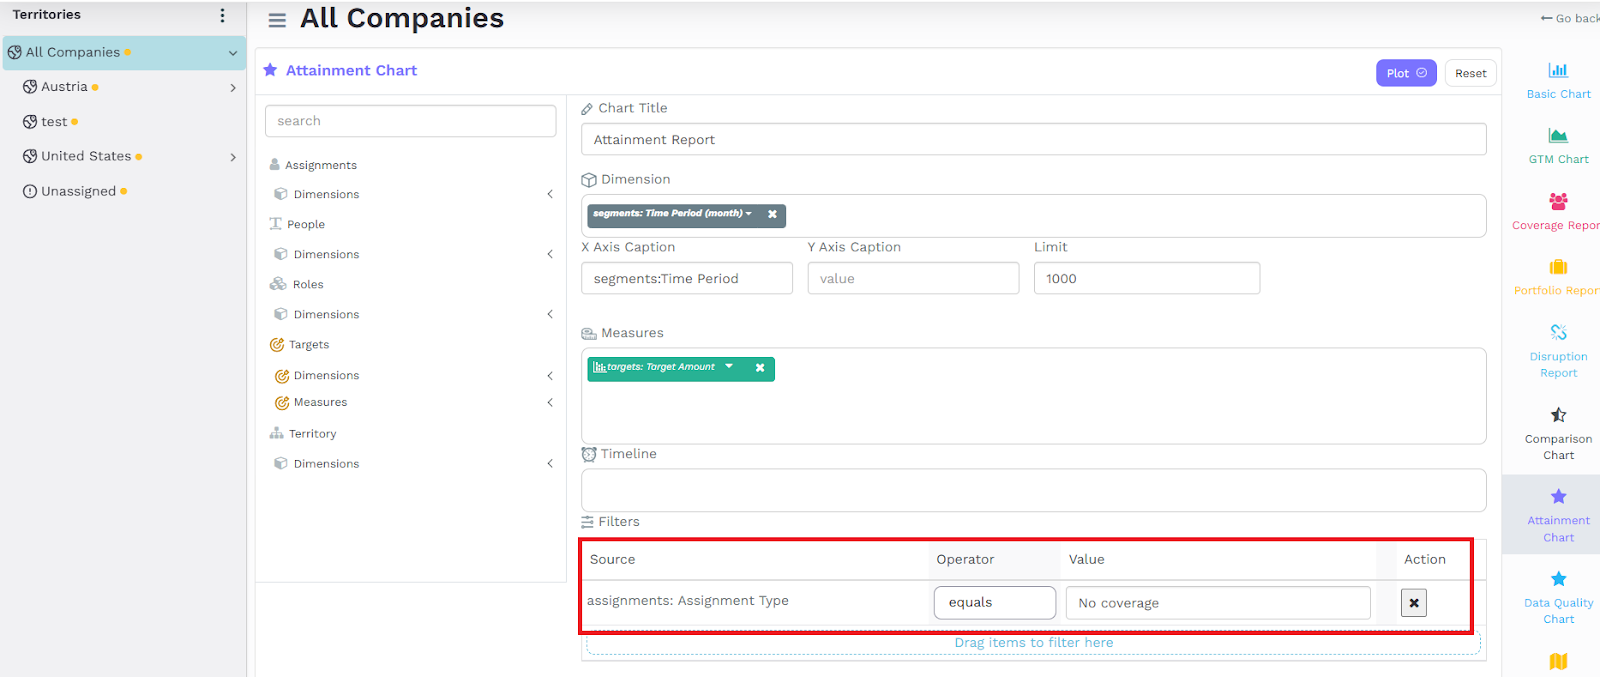
Figure 10 No Coverage Settings
Access your Fullcast instance and switch plans if applicable.
Navigate to the appropriate node and click the “Actions” button in the top right corner.
Select “Create a Chart” from the dropdown and click “Attainment Chart” on the right panel.
Expand “Dimensions” beneath the “Territory” option.
Drag and drop the “Time Period” option into the “Dimensions” field.
Expand “Measures” beneath the “Targets” option.
Drag and drop the “Target Amount” measure into the Measures field.
Information:
Apply the “isLeaf” filter with a value of “TRUE” when using the “Next Level” or “All Levels” options.
Click the “Plot” button.