Access your Fullcast instance and switch plans if applicable.
Click the Reports tab and click the appropriate dashboard.
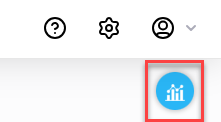
On the dashboard landing page, click the Chart Builder icon (blue chart).

Figure 1. Charts Callout
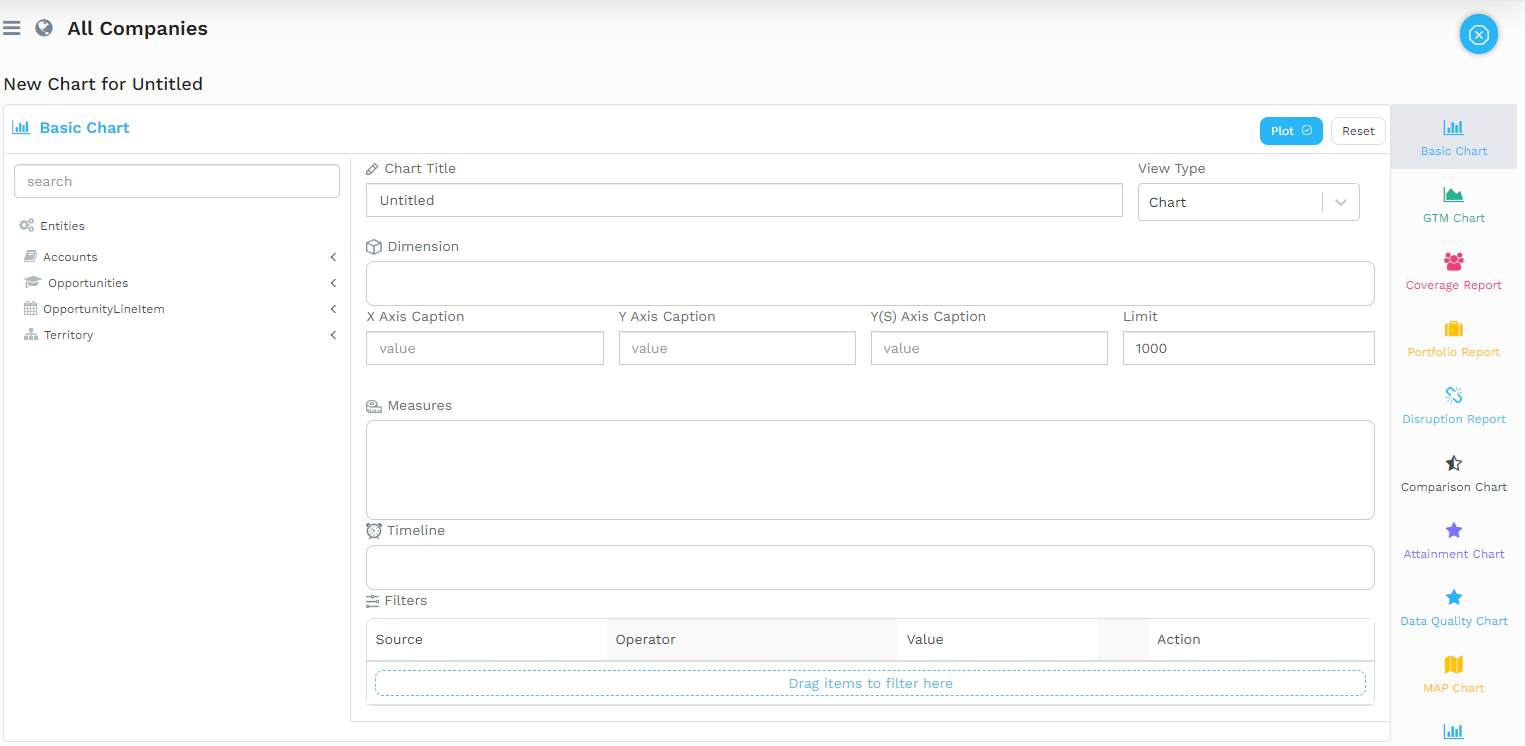
Use the Chart Builder to create your chart. Select the type of chart you'd like to build on the right column and fill out the form as per your requirements.

Figure 2. Chart Settings
Select Plot when finished. This chart has now been displayed on the dashboard that you selected.
Build your report.
When finished, select the Pin button in the Chart Action Bar.
Choose a dashboard from the decision center drop-down menu.
Select Confirm to complete the action.
Save Charts to Dashboards
- Updated on Feb 23, 2025
- Published on Nov 27, 2024
- 1 minute(s) read
Was this article helpful?
